Address
Washington D.C.

Work Hours
Monday to Friday: 7AM - 7PM
Weekend: 10AM - 5PM

How Satellite Imagery is Transforming Disaster Response: Stories from the Field

Introduction

Disasters such as hurricanes, earthquakes, and wildfires have devastating effects on communities, economies, and ecosystems. Timely and accurate information is crucial for effective disaster response, and satellite imagery has emerged as a powerful tool in this regard. By providing real-time data and detailed imagery, satellites help responders assess damage, coordinate relief efforts, and even predict the impact of disasters. Here, we explore real-world examples of how satellite imagery has transformed disaster response efforts.

Hurricanes: Tracking and Assessing Impact

Hurricanes are among the most destructive natural disasters, often causing widespread damage and displacement. Satellite imagery plays a critical role in hurricane tracking and post-impact assessment.

  • Example: Hurricane Harvey (2017)
    During Hurricane Harvey, satellites provided crucial data on rainfall intensity, flooding, and infrastructure damage in, prioritize rescue missions, and allocate resources effectively. The combination of radar imaging and optical satellite data revealed real-time flood extents, aiding in the evacuation of stranded residents and the delivery of relief supplies.
  • Example: Hurricane Ian (2022)
    When Hurricane Ian struck Florida, satellite imagery was used to monitor storm surges and assess damage to critical infrastructure like bridges, roads, and power grids. Synthetic Aperture Radar (SAR) technology allowed analysts to capture images even through cloud cover, ensuring accurate damage assessments despite adverse weather conditions. This information was shared with emergency response teams, enabling faster restoration of utilities and more targeted relief efforts.

Earthquakes: Mapping Damage and Guiding Recovery

Earthquakes can strike without warning, leaving widespread destruction in their wake. Satellite imagery provides a bird’s-eye view of affected areas, enabling responders to assess structural damage and plan recovery efforts.

  • Example: Nepal Earthquake (2015)
    After the 7.8 magnitude earthquake in Nepal, satellite images captured the extent of the devastation, including collapsed buildings and landslides. Organizations like the United Nations and local governments used this data to map the hardest-hit regions and deploy resources efficiently. The imagery also supported long-term recovery efforts, helping authorities rebuild infrastructure and mitigate future risks.
  • Example: Turkey-Syria Earthquake (2023)
    Following the powerful earthquakes in Turkey and Syria, satellite imagery was instrumental in detecting collapsed structures and blocked roads. Using high-resolution optical data, rescue teams identified areas where people were trapped under rubble. Satellite data also helped monitor the shifting topography caused by the quake, aiding in geological studies for future preparedness.

Wildfires: Monitoring Spread and Assessing Damage

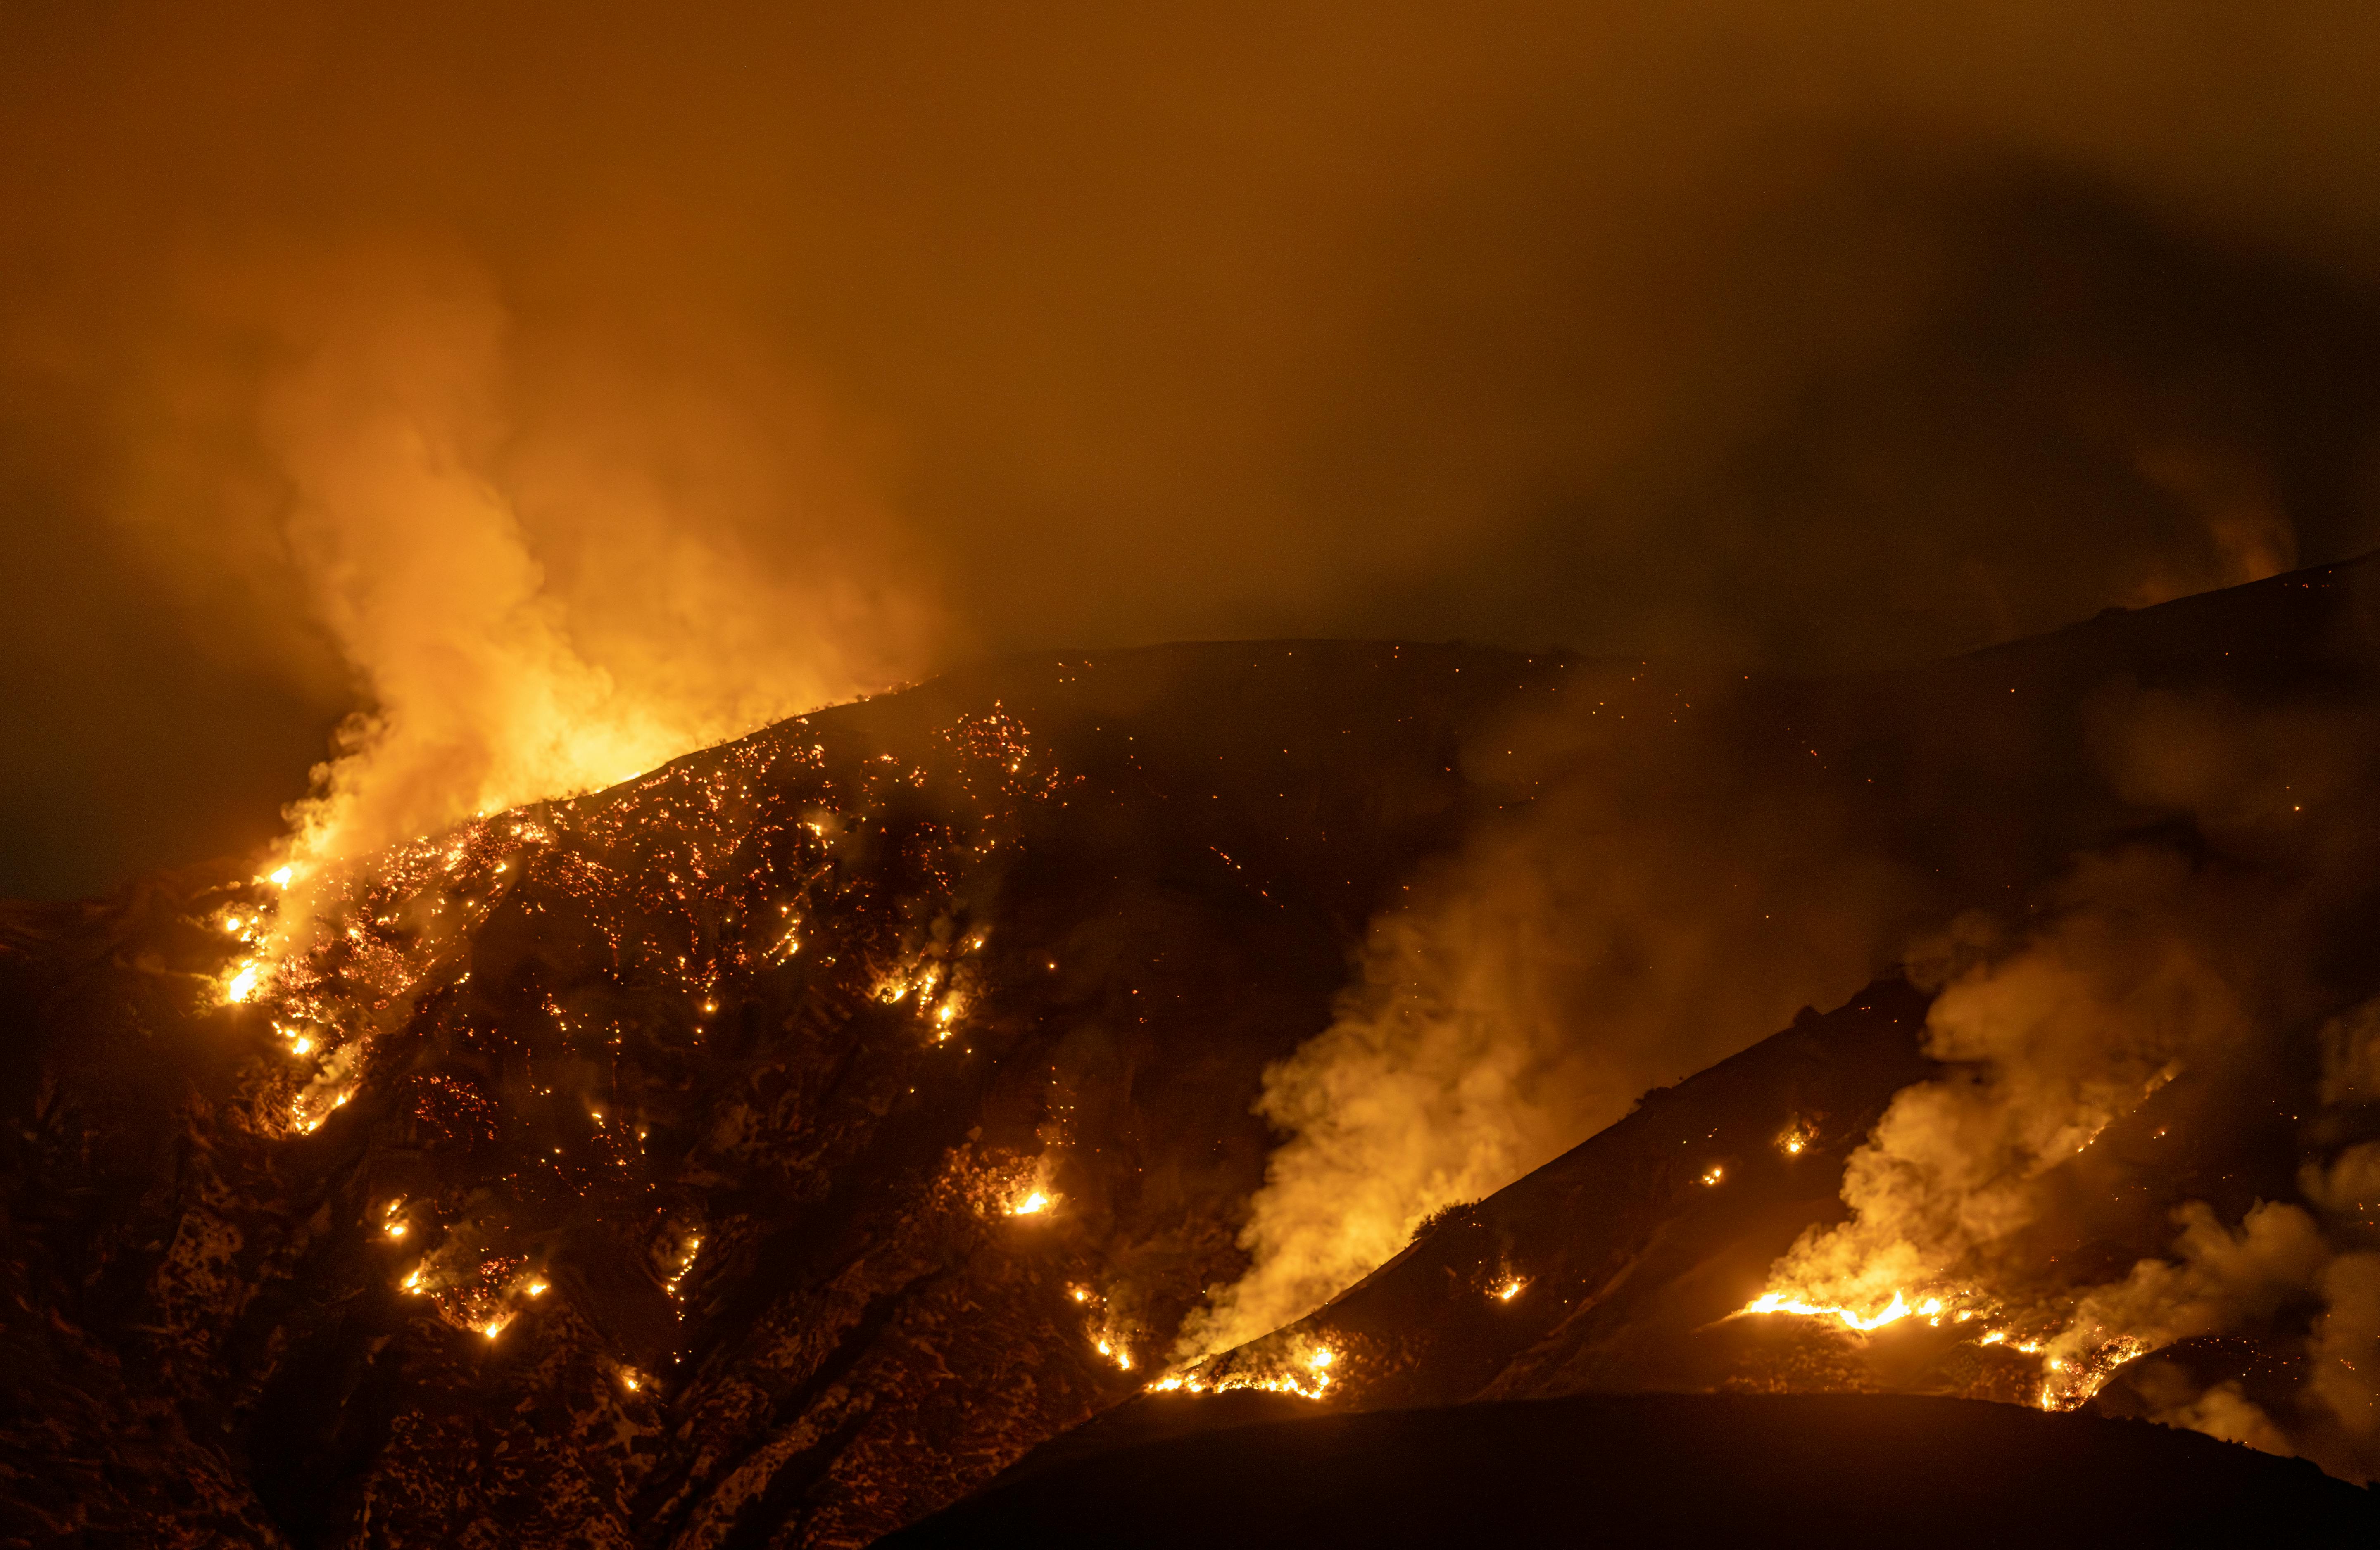
Wildfires are becoming increasingly frequent and severe due to climate change. Satellite imagery provides critical insights into wildfire behavior, helping responders contain the spread and minimize damage.

  • Example: Australian Bushfires (2019-2020)
    During the catastrophic Australian bushfires, satellites like NASA’s MODIS (Moderate Resolution Imaging Spectroradiometer) and ESA’s Sentinel-2 tracked the movement of fire fronts in real-time. Thermal imaging detected hotspots and monitored the progression of fires, allowing firefighters to strategize containment efforts. Satellite data was also used to measure the extent of burned areas, assess impacts on wildlife habitats, and estimate carbon emissions from the fires.
  • Example: California Wildfires (2021)
    In California, satellites played a crucial role in tracking the Dixie Fire, one of the largest wildfires in the state’s history. By combining infrared data and visible imagery, responders monitored fire intensity and identified evacuation zones. Post-fire analysis using satellite imagery also helped evaluate soil erosion risks and develop reforestation plans.

Conclusion

Satellite imagery has revolutionized disaster response by providing timely, accurate, and actionable data. Whether tracking hurricanes, mapping earthquake damage, or monitoring wildfires, satellites empower responders with the tools they need to save lives and minimize destruction. As technology advances, the role of satellite imagery in disaster management will only grow, offering even greater precision and effectiveness in the face of natural disasters.


Satellite Imagery in Commodity Markets: Predicting Trends with Precision

Introduction

Commodity markets are dynamic and influenced by a myriad of factors, including weather conditions, production levels, and geopolitical events. Satellite imagery is a game-changer in this space, offering traders and analysts real-time insights into agricultural and industrial commodities. From tracking crop health to monitoring mining activity, satellite data enables precise predictions that drive smarter decision-making.

Agricultural Commodities: Monitoring Crops and Yields

Agriculture is one of the most significant sectors benefiting from satellite imagery, as crop health and yields are heavily influenced by environmental conditions.

  • Example: U.S. Corn and Soybean Yields
    Traders use satellite imagery to monitor crop health across the Corn Belt in the United States. By analyzing NDVI (Normalized Difference Vegetation Index) data, analysts can assess plant vigor and detect stress caused by drought or pests. This information helps forecast crop yields, providing traders with a competitive edge in anticipating supply levels and pricing trends.
  • Example: Russian Wheat Production
    Satellite imagery was crucial in monitoring wheat fields during the 2022 geopolitical tensions involving Ukraine and Russia. Remote sensing data helped global traders estimate production disruptions and predict export levels, directly impacting global wheat prices.

Industrial Commodities: Tracking Mining and Production

The industrial commodities market, including metals and energy resources, relies heavily on satellite data to track production and inventory levels.

  • Example: Copper Mining in Chile
    Chile, the world’s largest copper producer, has several mining sites monitored by satellite imagery. By observing changes in mine activity, stockpiles, and surrounding infrastructure, traders can predict copper supply trends. For instance, a visible increase in activity at a mining site may indicate higher production, signaling potential price drops in the global market.
  • Example: Oil Storage and Shipments
    Satellites are used to monitor oil storage tanks and shipping routes worldwide. By analyzing tank “fill levels” through shadow analysis and tracking the movement of oil tankers, traders gain insights into global supply levels and transportation trends. This real-time data helps anticipate price fluctuations in crude oil markets, giving traders an advantage in timing their investments.

Integrating AI and Satellite Data in Commodity Markets

Artificial intelligence further enhances the value of satellite imagery in commodity analysis. AI algorithms process satellite data to identify patterns, detect anomalies, and make forecasts with greater accuracy. For example, machine learning models can predict crop yields based on historical weather patterns and current satellite observations, helping traders make informed decisions.

Conclusion

Satellite imagery has become an indispensable tool for commodity traders and analysts, providing real-time, accurate, and actionable data. From tracking agricultural yields to monitoring industrial production, satellite technology offers unparalleled insights that drive market predictions. As the integration of AI and satellite imagery continues to advance, the commodity markets will benefit from even greater precision, enabling smarter investments and more resilient supply chains.


FAQs

1. How is satellite imagery used in disaster response?
Satellite imagery helps track natural disasters, assess damage, and coordinate relief efforts by providing real-time and accurate data on affected areas.

2. What role does satellite imagery play in commodity trading?
Satellite data is used to monitor agricultural yields, mining activity, and oil storage levels, offering traders insights into supply trends and market conditions.

3. Can satellite imagery predict hurricanes or wildfires?
While satellites can’t predict hurricanes or wildfires, they provide critical real-time data for tracking their development, spread, and impact.

4. How does AI enhance satellite data analysis?
AI automates the processing of large datasets, detects patterns, and generates predictions, improving the accuracy and speed of satellite imagery analysis.

5. Are there free satellite data sources for disaster response and commodity analysis?
Yes, programs like NASA’s Landsat and ESA’s Copernicus provide free satellite data that can be used for various applications, including disaster response and market analysis.

Leave a Reply

Your email address will not be published. Required fields are marked *